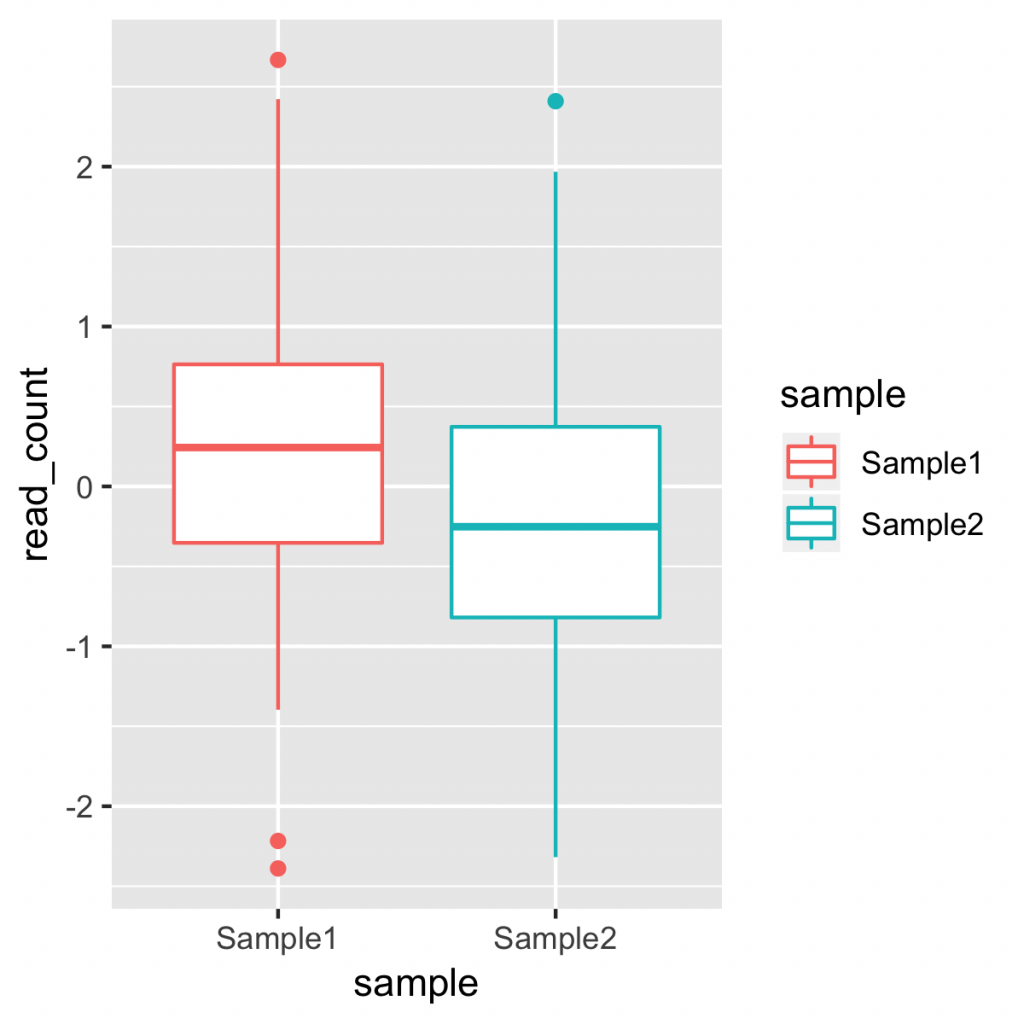
aes() オブジェクトに color または fill を指定すると、グループに応じて色付けできます。このとき、色をマニュアルで指定するには、 scale_color_manual() または scale_fill_manual() を用います。 ggplot の aes() に fill を指定したのち、geom_boxplot() のあとに、プラス (+) で続けて指定します。
scale_fill_manual(values = c(色1, 色2, ...))
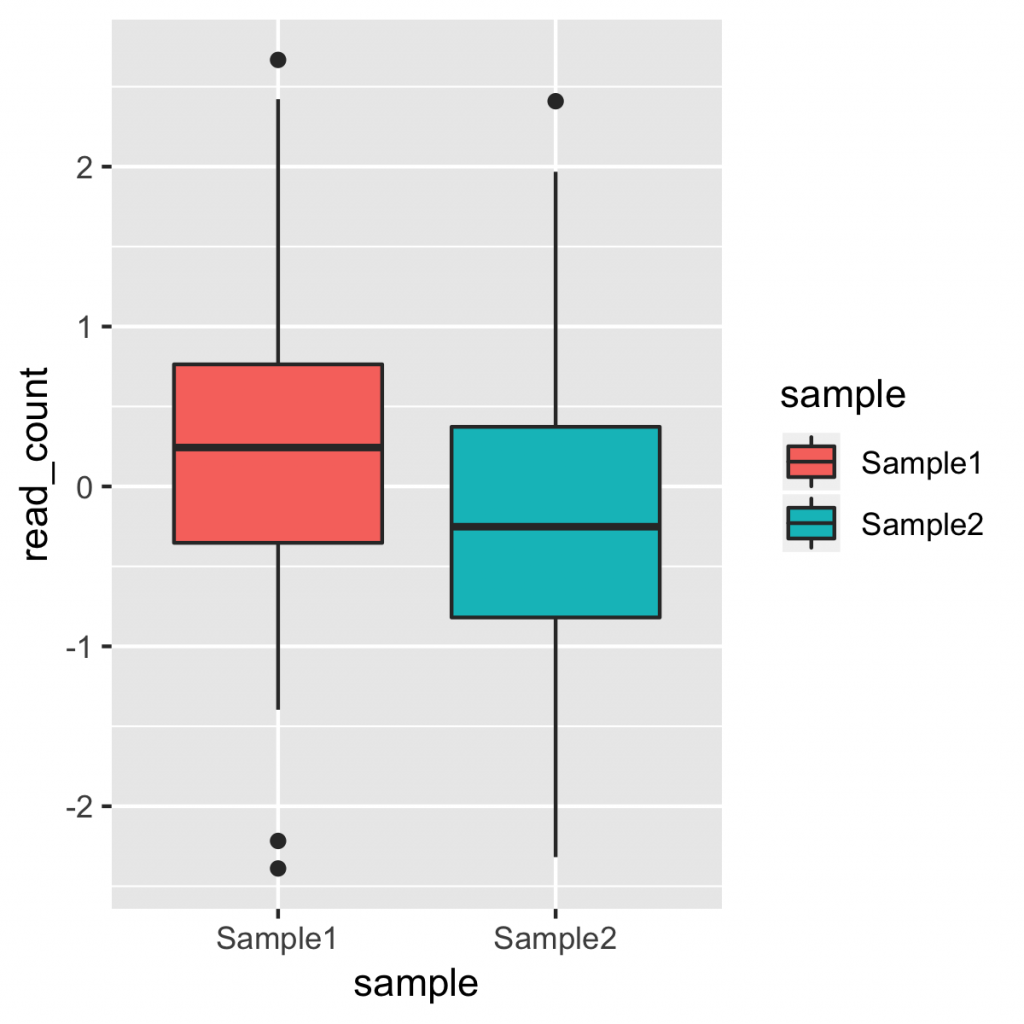
コードの例:
g <- ggplot(plot_data, aes(x = sample, y = read_count, fill = sample))
g + geom_boxplot() + scale_fill_manual(values = c("salmon", "royalblue"))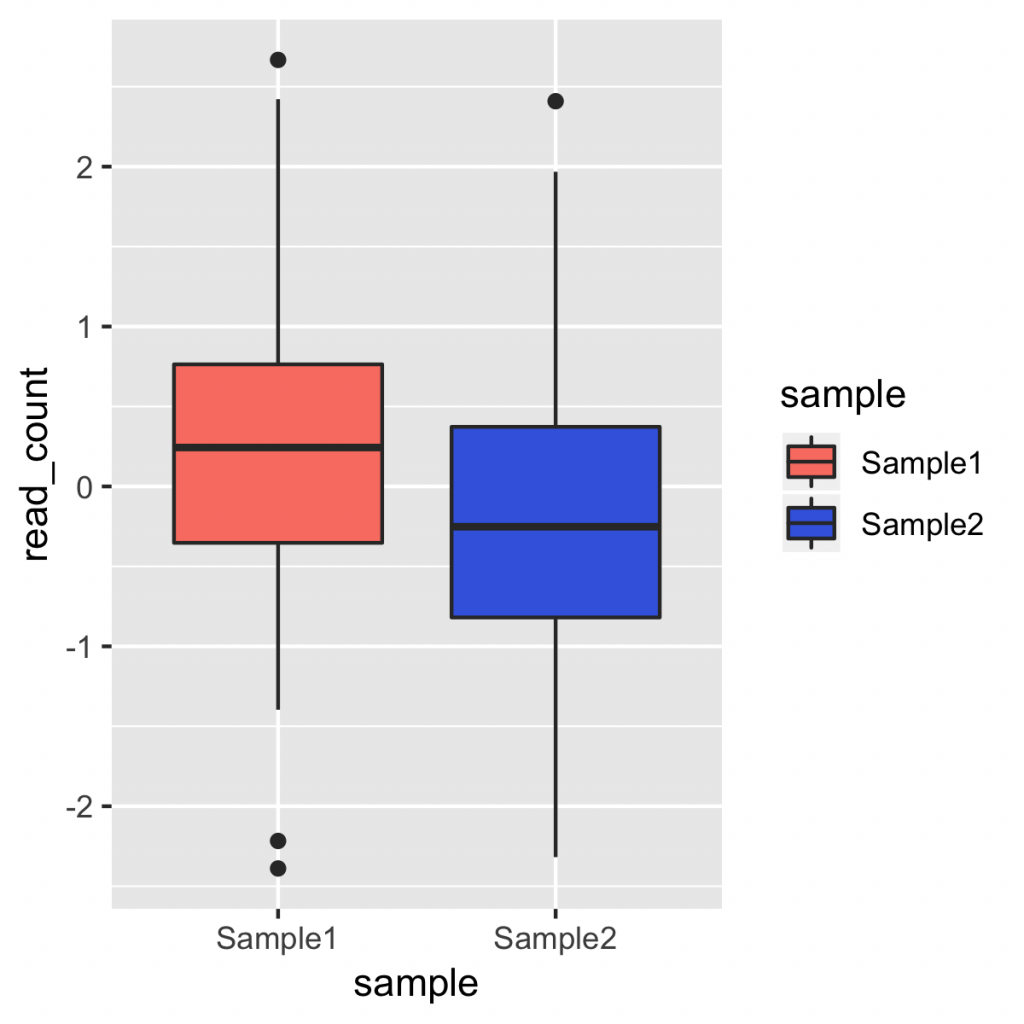
複数の色を指定するには、予め定義されたパレットを用いると便利です。 RColorBrewer のパレットを使える scale_fill_brewer() 関数があります。
g + geom_boxplot() + scale_fill_brewer(palette = "Spectral")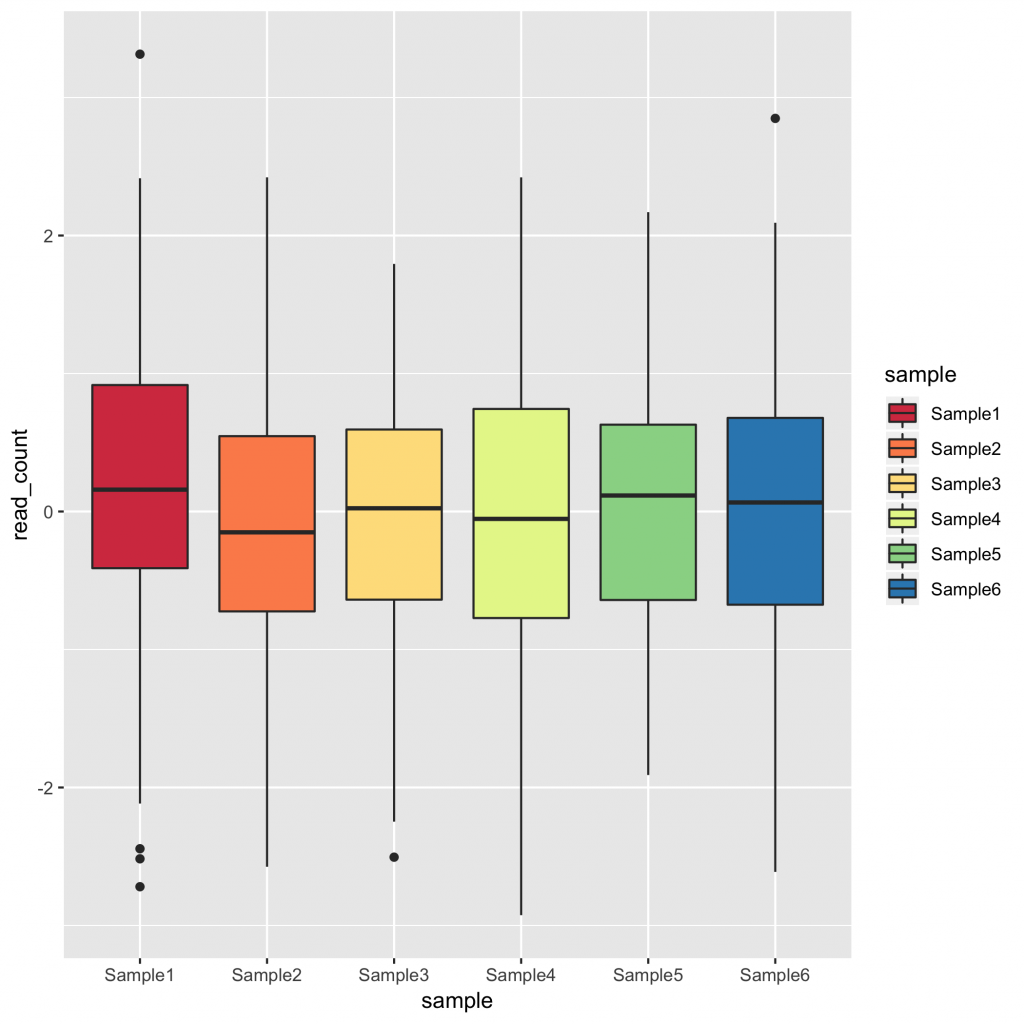
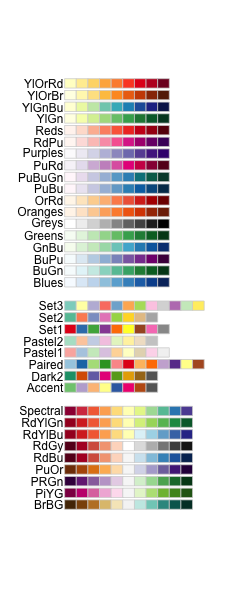
brewer のパレットに指定できる色の例です。YlOrRd, YlOrBr, Set1, Set2, Dark2, Spectral などがあります。(文字列として指定するので、ダブルクオーテーションで囲むのを忘れずに。)
scale_color_manual, scale_fill_manual()
https://ggplot2.tidyverse.org/reference/scale_manual.html