ggplot2 を使うと、ボックスプロットに、ドットプロットを重ねて描画することもできます。バイオリンプロットのときと同様に、 geom_boxplot() と geom_dotplot() を + で続けて指定します。
g + geom_boxplot() + geom_dotplot()
g は、ggplot のオブジェクトです。具体的には、下記のようなコードです。
input_data <- tibble("Sample1" = rnorm(100),
"Sample2" = rnorm(100))
plot_data <- input_data %>%
gather(Sample1, Sample2, key = "sample", value = "read_count")
g <- ggplot(plot_data, aes(x = sample, y = read_count))
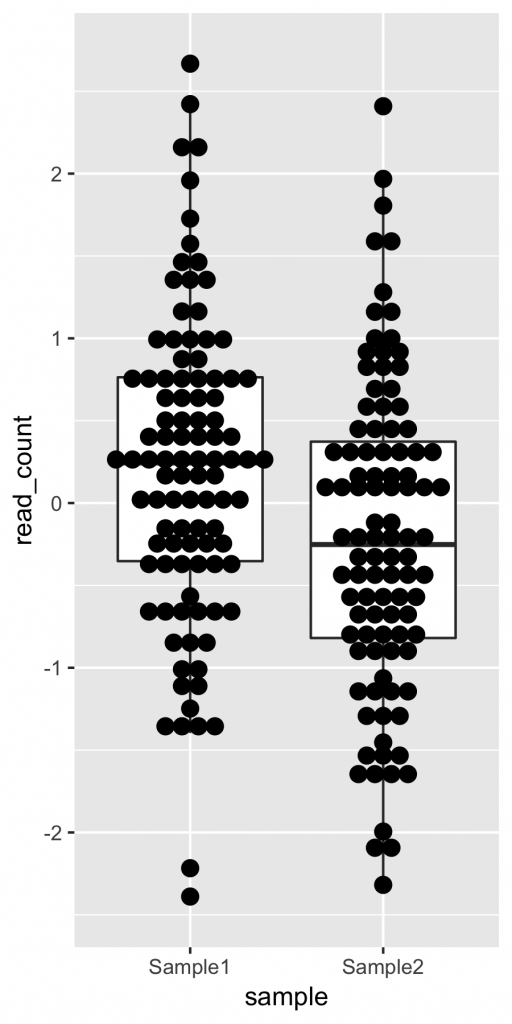
g + geom_boxplot() +
geom_dotplot(binaxis = "y", stackdir = "center", binwidth = 0.1)下記のようなイメージが出力されます。
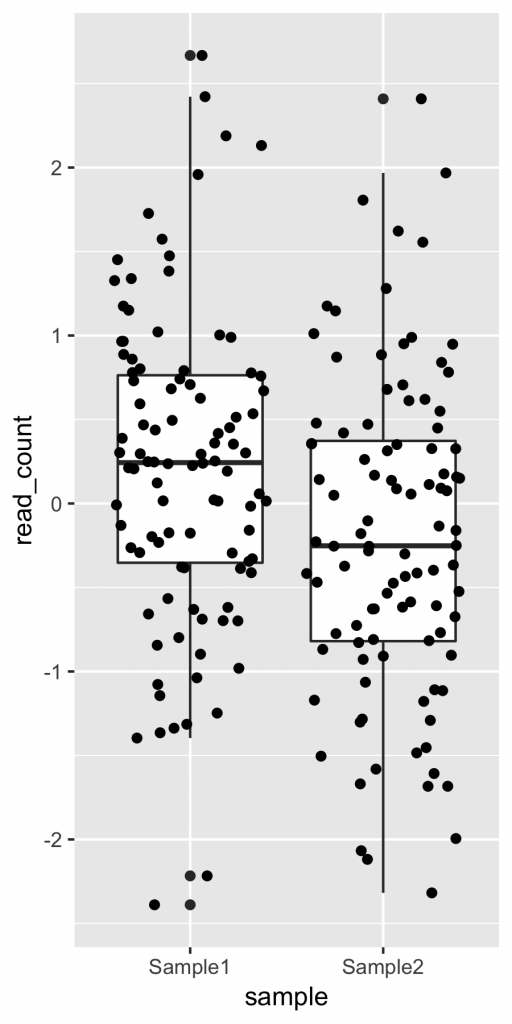
なお、ドットを整列させない場合は、 geom_jitter() 関数を用います。
g + geom_boxplot() + geom_jitter()ドットが横方向にランダムに描画されます。ランダムな結果なので、実行するたびにドットの位置が変化します。(見た目だけの問題なので、ばらつきに意味はありません。)geom_point(position = “jitter”) でも同様です。