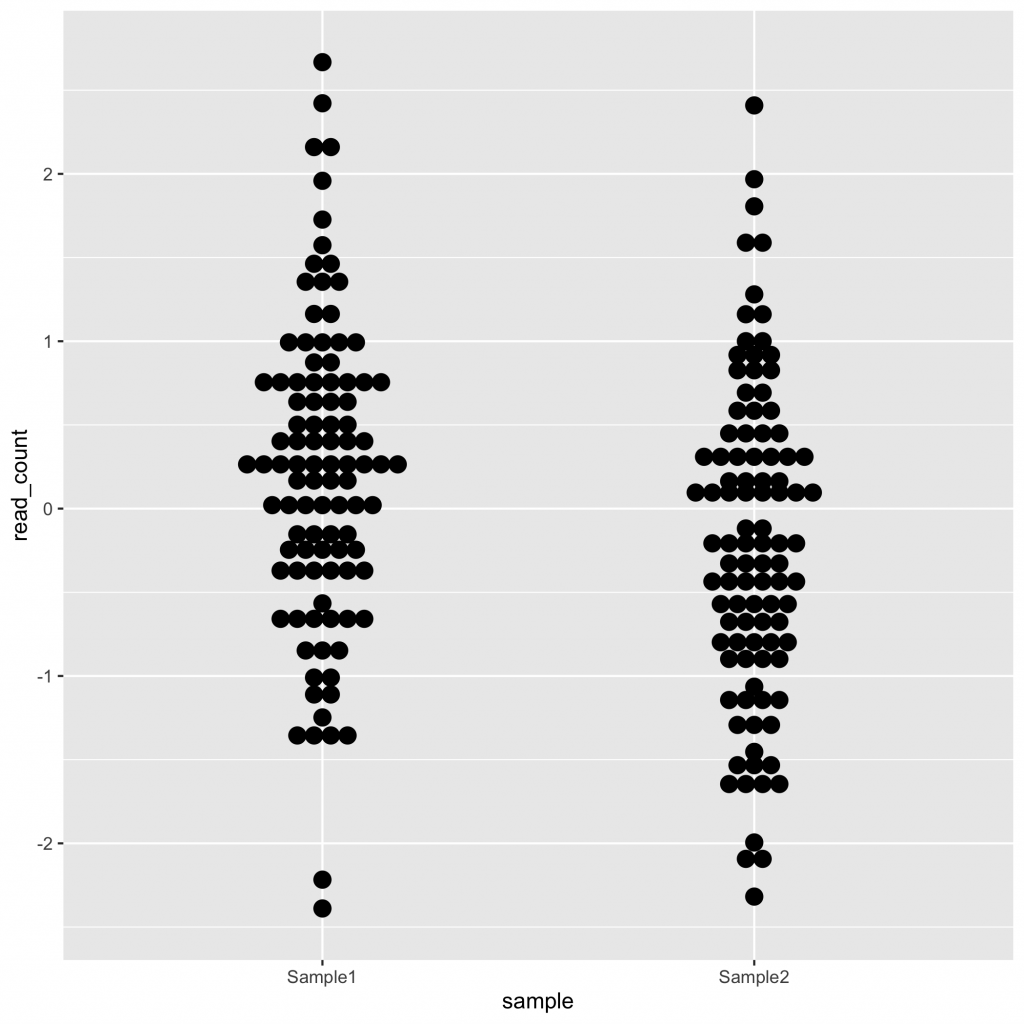
データ数がそれほど多くない場合は、ボックスプロットに代わり、ドットプロットが用いられることもあります。ドットプロットは、データの数だけ、点(ドット)を表示するので、データの広がりをイメージしやすいでしょう。
geom_dotplot(binaxis = "y", stackdir = "center", binwidth = 0.1)
ドットプロットを書くには、geom_dotplot() を使います。ボックスプロットのようにサンプルを横に並べるには、binaxis = “y” を指定します。また、ドットを左右対象に並べるには、 stackdir = “center” を指定します。 binwidth は、ドットを並べる区画の幅です。ドットの大きさにも影響します。(binwidth は、何回か描画して、試行錯誤することになると思います。)
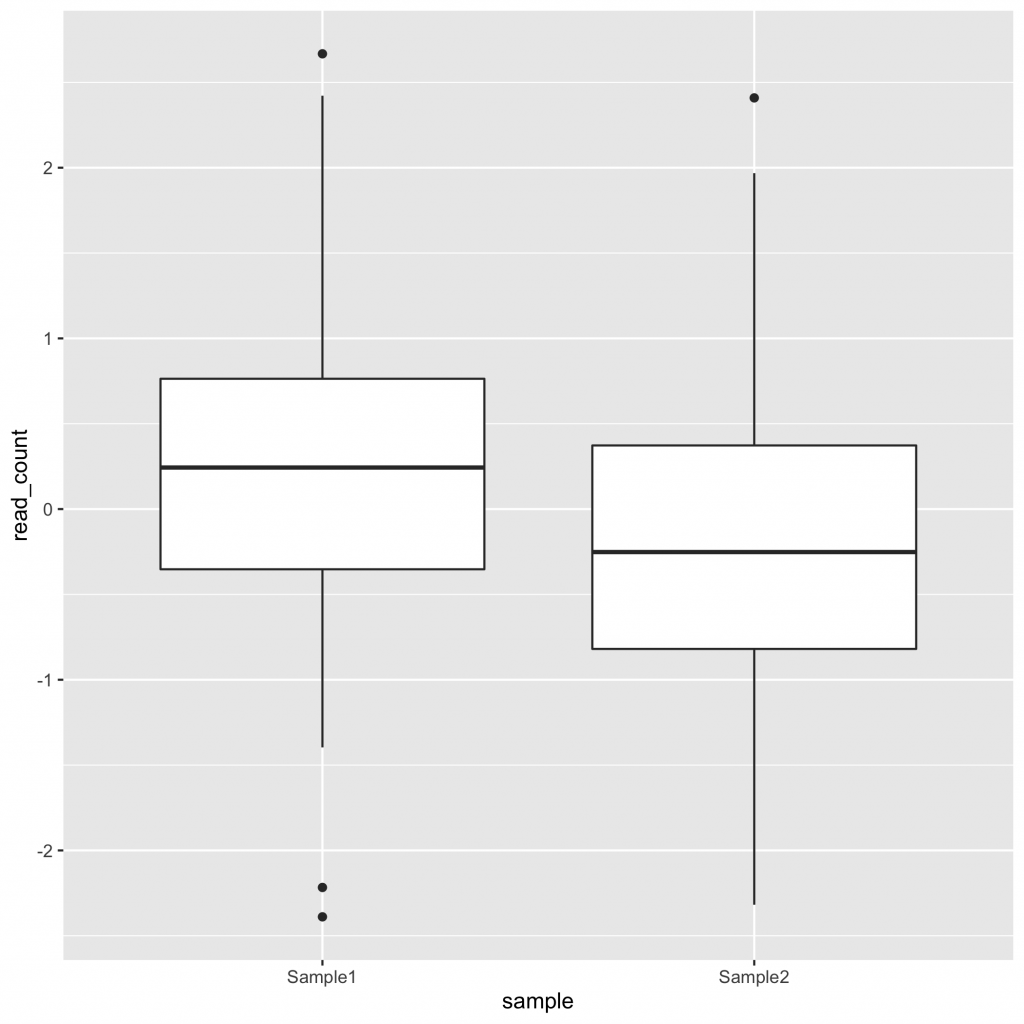
ggplot オブジェクト (=g) を作るまでは、ボックスプロットと同じです。g を定義しておくと、geom_boxplot() を geom_dotplot() に変更するだけで描けます。
input_data <- tibble("Sample1" = rnorm(100),
                     "Sample2" = rnorm(100))

plot_data <- input_data %>%
  gather(Sample1, Sample2, key = "sample", value = "read_count")

g <- ggplot(plot_data, aes(x = sample, y = read_count))
g + geom_dotplot(binaxis = "y", stackdir = "center", binwidth = 0.1)